Sentiment Overview: Week Of July 1st, 2011

Due to the shortened holiday week (July 1st, Canada Day & July 4th US Independence Day) I’ll be taking a long weekend so this week’s sentiment overview includes data as of Thursday. If material changes arrive on Friday I’ll update it to reflect that.

To my Canadian and US readers, have a great weekend celebrating your country’s founding! And remember to use a designated driver.

Sentiment Surveys
Retail investor sentiment according to the weekly AAII improved slightly along with the recovering stock market. The bullish grew slightly to 38.3% (from 37.5% last week) and the bears fell from 36% to 30% bringing the bull ratio up to 56%. This is normal behavior but of course, as contrarians, we’d prefer to see a bit more skepticism to cement the floor.

Investors Intelligence
Almost 40% of the stock market newsletter writers monitored by ChartCraft for their Advisor Sentiment index expect further price appreciation while 27% were still bearish. It would seem from the price action that the correction is over however at least from this indicator the recent retracement was a very shallow one compared to previous bull market corrections:

The four week moving average of the Investors Intelligence bull ratio (bullish % divided by the decideds) is still tracking downwards without having reached levels that have previously matched market bottoms. This is mainly because unlike other major corrections the number of bears didn’t rise above 28%. Normally we see 35-40% bears at intermediate market lows.

NAAIM Survey of Manager Sentiment
As with the other sentiment indicators, the NAAIM survey of manager sentiment increased slightly this week rising to 33% exposure from 29% a week earlier. Digging into the data a bit more we find that the most bearish response to the survey is a surprising 140% short position against the market. This suggests that there are still some who are skeptical and a few who are very much not believing in the bounce higher.
Continue reading

Posted in Uncategorized | Leave a comment

Sentix Sentiment: Crude Oil Pessimism At Extreme

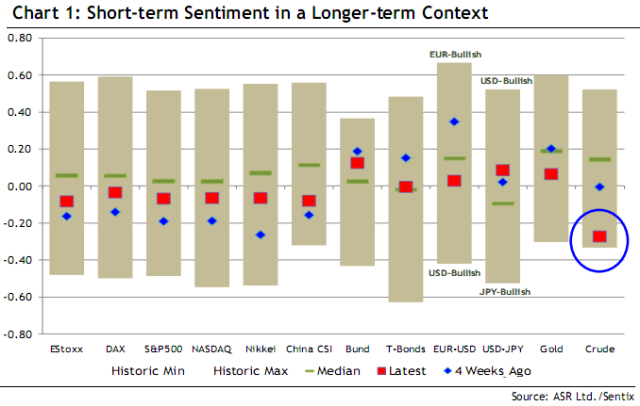
As a follow-up to last week’s commentary on crude oil sentiment and fading the IAE here is the latest Sentix sentiment overview showing the exceptionally pessimistic sentiment in crude oil:

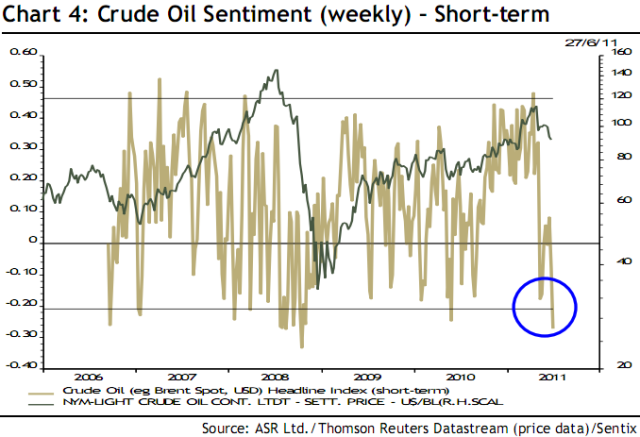
The only other market approaching this level of gloom and doom is China’s equity market. Here’s a more detailed look at the Sentix (short term) crude oil sentiment index:

The last time that we saw such an extremely negative sentiment from this indicator was during the 2008 crash in oil prices. Back then I wrote about the dangers of being long the crude oil market as it approached clear parabolic status and called it a ‘bubble’.

It is notable that the decline in price we have seen since early May does not even being to approach the catastrophic declines that occurred in 2008. But even so, sentiment is now as negative as it was back then. From a contrarian perspective, this suggests that it is smart to fade the IEA’s recently announced sales.

Apart from a directional bet, another way to play this is to position a trade that takes advantage of the narrowing of the gap between the Nymex and Brent crude oil markets. As of Monday the spread is a little over $13 but earlier this month it ballooned to $23 a barrel. Usually Brent trades at a small discount to West Texas Intermediate Crude and over the next few weeks, the lopsided sentiment suggests we’ll see an eventual return to that.

Posted in Uncategorized | 3 Comments

Sentiment Overview: Week Of June 24th, 2011

Below is this week’s summary of sentiment happenings:

Sentiment Surveys
The stock market rebound that arrived earlier in the week was enough to put some wind in the sails of the retail US investor. The AAII weekly sentiment survey showed an increase in the bullish camp to 37.5% and a retreat in bearishness to just 35.7%. So once again, we have more bulls than bears – something we hadn’t seen since late April.

In the end, the short term average of the AAII bull ratio is little changed and still at contrarian bullish levels:

I would have preferred to see sentiment stubbornly bearish in the face of the recent price gains. But keep in mind that the survey was taken on Wednesday – the best day of the week. We’ll have to wait for next week’s survey results to see how they react to the price declines that occurred in the last half of this week.

As well, the Farrell Sentiment Index (not shown) which takes into account half of the ‘neutral’ respondents has provided a buy signal by rising from below 0.50 and crossing higher.

Investors Intelligence
Investors Intelligence Advisory Sentiment index, ChartCraft’s measure of newsletter sentiment, showed a smidgen more bearishness this week. The bulls increased to 37.6% (from 37%) and the bears to 28% (from 26%). Overall, very little was changed in the general state of this indicator. We’ve seen a decline but not one that is significant enough to match previous correction lows.

NAAIM Survey of Manager Sentiment
The headline numbers for this survey increased slightly from last week. The average market exposure inched higher to 29% from 26%. But what I want to bring to your attention more than that is the difference between the most bullish responders to the poll and the most bearish. This ‘Polarity’ is now declining rapidly after reaching a new record in late April:
Continue reading

Posted in Uncategorized | 6 Comments

Fading The US Strategic Petroleum Reserve Sale

Yesterday while discussing copper prices I hinted that crude oil was in a similarly washed out circumstance when it comes to sentiment. Today’s decision from the International Energy Agency (IEA) to release 60 million barrels of oil from their strategic reserves sent crude oil prices down further and deepened an already oversold condition (Press Release).

The US will release half of the total IEA sum with Europe releasing 18 million and Asian countries another 12 million. The news was enough to send crude oil down sharply. This is an indication of the current pessimistic outlook holding sway over this market. If anyone had actually stopped to do a back-of-the-envelope calculation they would have noticed that this amounts to very little indeed.

Consider that the global consumption is running at 89 million barrels a day. So 60 million will cover it for a bit more than 16 hours. According to the US Energy Information Administration, the average daily consumption of crude oil in the US was 18.7 million barrels in 2009 and 19.15 million in 2010. So the US portion represents about a day and a half’s worth of oil.

Finally, although the big number in the news is 30 million, there is no guarantee that that amount will be supplied. The process in the past has been to invite bids from private companies to sell the crude. In 2005, after the disruption caused by Hurricane Katrina, the US government made available 30 million through a similar ‘notice of sale’. They received 14 bids, of which only 5 were accepted and in the end, resulted in total sale of only 11 million barrels of oil.

What the crude oil market may be reacting to is the implied threat from the IEA to become a more active player to massage prices lower. No doubt today’s IEA announcement was a not so subtle hint to Saudi Arabia.

The real story is whether Saudi Arabia will in fact turn on the spigot as they have threatened to do after the disastrous OPEC meeting earlier this month. On one side stands Saudi Arabia and on the other Iran and Venezuela. If the US friendly Saudis do in fact increase supply and push down demand (with a little help from the unwinding of the long-only futures bets put on by the hedge funds) then we will see something akin to QE3. Something else complicating this is the difference in the quality of the marginal oil production that Saudi Arabia can add. The loss of the Libyan oil is exaggerated by the fact that it was some of the lightest and sweetest crude available while the Saudi Arabian oil is sour and requires much more refining.

Realistically though I’m not sure how an international agency whose purpose is to stockpile crude oil in the event of a catastrophic supply disruption will now take on the role of a supplier. The two roles are diametrically opposed. There is no doubt that the global economy needs lower oil prices but whether the IEA’s machinations will provide that is up for debate.

In the middle of all this there may be a trading opportunity if we look at this from a contrarian view point. First, some of the best buying opportunities camouflage themselves amidst a thicket of negative headlines. Second, price has already been going down for some time, falling more than 19% from a top in April. Like equity prices, crude oil reached its 200 day moving average.

And third, sentiment towards crude oil is running low. By the end of the week we’ll have some new numbers to work with but the latest shows a significant deterioration in bullishness. We’re now seeing about as much negative sentiment as we did last summer.

Finally, the Commitment of Traders reports show that the Commercials are rapidly reducing their gargantuan net short position – built up during the first quarter of this year. And both Large and Small Speculators are rapidly moving to reduce their large long positions.

While as a consumer and as a global citizen I wish for lower oil prices, the current market cross currents and sentiment suggest that we’re about to see the opposite.

Most analysts are similarly suggesting that future prices will be higher. Here’s a brief rundown from Reuters:

GOLDMAN SACHS
We estimate that a 60 million barrel release by the end of July has the potential to reduce our 3-month Brent crude oil price target by $10-12 a barrel, to $105-107 a barrel.
We would expect the release to have less of an impact on prices further out the curve, as the oil would be absorbed to meet current demand.
Net, we would expect that the potential impact on Brent crude oil prices in 2012 to be closer to $5-7 a barrel on average

JP MORGAN
It is important to recognize that the IEA countries will “offer” or “make the petroleum available” to theSource: IEA Oil Market Report market. That does not necessarily mean that the oil offered will be taken up… For political expediency, the IEA is unlikely to want to be seen. There is an implicit, but not yet apparent” release price”.

PRESTIGE ECONOMICS
While this is price bearish for crude oil today and in the immediate term, these measures are being implemented with the intent to stave off significantly higher prices in the near- and medium-term. The fact that the IEA had to go to these lengths in the second year of an expanding business cycle says something very bullish about crude oil prices in the medium-and long-term. The global economy is up against a wall in terms of receiving additional oil supplies to meet demand. Additional demand or supply disruption would have a massively bullish impact on prices. After all, releasing emergency inventories is a last resort.

CAPITAL ECONOMICS
Our view has always been that oil prices would fall anyway given the deteriorating prospects for demand and the likelihood that some OPEC members, led by Saudi, would raise output regardless of the formal ceilings. Overall, the result on Thursday was fresh falls in equities and commodity prices, and in safe haven government bond yields, with the dollar regaining ground. We expect more of the same over the rest of the year, consistent with our view that the US S&P 500 will hit 1200; Brent crude will be back below $90pb.

As well, Gregor.us is equally bullish:

Releases of oil from inventory are counterintuitively bullish, not bearish, for prices. While oil prices no doubt will be rocked for several months now, releases such as these only highlight the fundamental problem at hand: structurally restrained supply. For example, the OECD could have turned to non-OPEC producers within their sphere of influence and asked them to produce more. But Non-OPEC producers, accounting for 57% of total global supply, have no spare capacity. The oil market is going to figure this out more quickly than most imagine.

As is Jim Ritterbusch of Ritterbusch & Associates. He believes oil will be back above $100 by the end of the summer.

Posted in Uncategorized | Leave a comment

Copper A Buy Again After Brief Correction

In February I shared a chart of the Bloomberg Copper Sentiment index and wrote:

It would be truly poetic if copper were topping here, as sentiment suggests. After all, with the advent of not one but two physical copper ETF’s the ducks are about to get fed.

With hindsight we now know that copper did in fact peak in February. Since then it has meandered lower, participating in the general commodity retracement. The introduction of the two ETFs (iShares Copper Trust ETF and the JP Morgan Physical Copper Shares ETF) were fantastic sentiment signals.

To be fair, before I pat myself too furiously on the back, I had been negative on copper since late 2010 when I wrote “Copper Loses its PhD Moniker“. But the commodity totally ignored my brilliant analysis and kept going up.

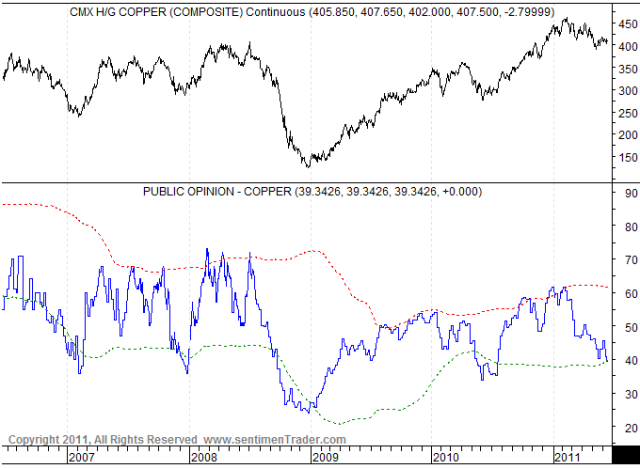
Now, after some months of tepid correction, copper sentiment is down to levels that have usually marked significant lows. The Bloomberg Sentiment which I pointed to previously is not yet down to abysmal levels. Its 4 week moving average has fallen from a spike of 76% to 62% (chart can be seen here). But an aggregate measure of copper sentiment which takes into account several surveys, including the Bloomberg one, from the always sharp mind of Jason Goepfert (of SentimenTrader) is showing an exhaustion of the bullishness that was prevalent back in Febuary:


Source: SentimenTrader.com

What’s surprising is the relative shallowness of the current correction and how in spite of it being so milquetoast, it has somehow managed to depress most people involved in this commodity. From peak to trough copper retraced 15.6%. Silver during the same time fell 31%. Copper is a rather volatile commodity and it isn’t unusual to see large retracements. For example, last summer it corrected almost 24%.

Commitment of Traders
We have corroborating data from the CFTC issued Commitment of Traders reports. The latest data shows a complete reversal of positions between the major market participants. Whereas in early 2011 Commercials – miners like Freeport-McMoRan (FCX) – were short and Small Speculators (retail futures traders) long, the current market is characterized by the opposite.

Of course, the fundamental issues that troubled me haven’t really been resolved. Copper is still being punted about as a plaything for the large speculators decoupling it from its historical normative demand/supply forces. But the sentiment and Commitment of Traders reports both suggest that the correction here has been enough to flush out the weak hands and prepare copper for another leg up.

Almost the same can be said for crude oil by the way.

Posted in Uncategorized | Leave a comment

Citigroup Economic Surprise Index

The Citigroup Economic Surprise Indexes are a clever concoction that measures the variations in the gap between the expectations and the real economic data. The input consists of the actual econometric data that moves foreign exchange markets – the bigger the data moves forex markets, the more significant its weight in the index. And the consensus among economists before the data is released.

When the CESI is positive it means that the released data have been better than the expectations. In other words, economists have not ratcheted up their optimism enough to match the data coming in. When CESI is negative, it means that actual results have been worse than expectations.

Just a few months ago in March, when most were worrying about a coming weakness (or a double-dip recession) the surprises were very positive. Back then, the average economist, unlike the sentiment surveys, was quite pessimistic. At least relative to the actual results.

Now, we’re seeing the opposite happen with CESI dropping to negative levels not seen since the bear market lows:

In the above chart you can compare the Citigroup Economic Surprise Index for global data and the Citigroup Economic Surprise Index for the US. By far, the US CESI is showing a deeper decline. The European CESI (not shown) is actually still quite a ways from a similar extreme low suggesting that their markets have not yet seen a washout of selling.

As a reader pointed out last week, this indicator is now suggesting that we are at an important inflection point. However, because troughs correspond well to stock market lows, this indicator is not interpreted through a contrarian lense.

That is to say, when economists are too ‘pessimistic’, markets top and when they are ‘optimistic’ markets bottom. The linked to article incorrectly states that “economists are now overly pessimistic”. If this were the case, we’d be seeing positive CESI (as real data would exceed their low expectations). In fact, we’re seeing the opposite: economists that are so ‘optimistic’ that the actual results have been worse than their average consensus.

The important take away point here is when economic data is absolutely horrendous – as it is getting to be now – important lows are close at hand. When everything is sunshine and lollipops, you better run and find a good bombshelter!

Posted in Uncategorized | Leave a comment

Technical Overview: Week Of June 20th, 2011

After retracing 12%, from peak to trough, the stock market opened and closed almost unchanged for the week. On the charts this produced a doji candlestick which is usually interpreted as indecision in Japanese candlestick charting schools.

The S&P 500 index is now down to important support levels supported first by the simple 200 day moving average and second by the March 2011 lows (blue line). The long term moving average is not by itself not really significant nor magical. But it is psychologically important since it is foremost in traders’ minds. Losing the support of the long term trend makes many fearful of further losses and usually results in a self-fulfilling prophecy.

As we’ve already seen, the bulk of the various sentiment data featured in the weekly overview is supportive (in a contrarian way) of higher stock prices. Also, Rydex traders who are atrocious when it comes to market timing have thrown in the towel. The fact that this coincides with the support levels above is a good sign.

As I’ve mentioned previously, multiple indicators are suggesting that the correction is about to end; with one important proviso. That being that we are still enjoying a bull market. It is never easy to find market tops since they are marked by a slow degradation of momentum rather than the fearful spikes of selling we see in important bottoms. However, aside from the weakness in the cumulative advance decline lines, I haven’t seen any strong indications that the bull market has ended.

The cumulative AD line is a bit worrying. However, we’ve seen it act weak in previous bull market corrections. The most pronounced accompanied the April 2010 top.

Another technical indicator of breadth is the S&P 500’s Hi-Low index which is a ratio of the new 52-week highs relative to the new 52-week lows. As with other indicators, it is suggesting that stock prices have been pushed down enough to be attractive (within a bull market environment):

Posted in Uncategorized | 2 Comments

Sentix Sentiment: Less Pessimistic But Still Cautious

The current sentix sentiment readings for various indexes and asset classes suggest that investors are still cautious while moving away from the recent pessimism:

Among world indexes, the two with the most bearish sentiment are Japan (Nikkei) and China (CSI). Among commodities, crude oil is the least loved.

With the Greek sovereign debt crisis coming to a head, it isn’t surprising to see the European banking sector get clobbered in the sentiment readings:

Of course, from a contrarian perspective this means that we’ve seen or are about to see an important low. Remember that market bottoms are made during times of pessimism and negative news. By the time the crisis is resolved, the rebound will be well underway.

The relative Banking index is close to reaching the 2009 bear market lows and finding support during the gloom and doom related to the Greek debt crisis.

Posted in Uncategorized | Leave a comment

Sentiment Overview: Week Of June 17th, 2011

Below is the summary of sentiment data for the financial markets:

Sentiment Surveys
Even though the S&P 500 index was slightly lower, the weekly survey of retail US investors was more optimistic this week than last. This is surprising since we usually see sentiment reflect market moves. Those expecting stock prices to be higher in 6 months rose to 29% (from 24.4%) while the bears decreased to 43% from 48%. The change was small but enough to push the bull ratio up to 40% from 34%.

This is 43% the average bull ratio and therefore still a very low level of optimism overall. The four week moving average of the bull ratio was basically unchanged and the lowest since late July 2010. For the chart, see last week’s sentiment overview.

Investors Intelligence
The story remains the same with this indicator. Just as last week optimism is waning but there are still far too many newsletters who believe the current market weakness is merely a ‘correction’. While the bulls have receded from a peak of 57% in April to 37% this week, the bears are still too few in number at 26% to provide a meaningful signal.

Sentiment & Market Tops
Mark Hulbert wrote an interesting article earlier in the week in Barron’s: “Is the Bull Market Over?“. He looks at the behavior of the sentiment surveys mentioned here (Investors Intelligence, Hulbert Newsletter Sentiment, and AAII) and compares their pattern at major market tops.

His conclusion is that these sentiment surveys are coincident indicators. Based on this he suggests several ways that we can check to see if a recent top (such as the one we’ve just had) is the end of a bull market. One way to tell is if the peak in sentiment and the peak in stock market prices are separated by more than a few months. In such a case a major top is unlikely.

Another way to confirm a major top is to check if sentiment has reached historically extreme levels. If instead sentiment indicators have peaked at lower levels then a major market top is unlikely. Based on these two key variables, Hulbert concludes that we can’t rule out that the May top will mark a ceiling for prices for some time.
Continue reading

Posted in Uncategorized | 7 Comments

Rydex Traders Throw In The Towel

Regular readers will remember that in late January I pointed out that based on the trading activity within the Rydex leveraged ETFs, there was a market top in sight. A few weeks later in February it did indeed arrive.

Then again in early May I pointed once more to the same indicator and suggested that we were about to see have another market top. This time the market reached a peak immediately.

In the light of those two prescient warnings, the market weakness we’ve experienced is understandable. The S&P 500 index is down more than 7.5% from its peak and the Nasdaq Composite has retraced more than 9%.

So what is this accurate indicator telling us now?

Instead of showing you the raw Rydex Leveraged ETF ratio as before, I thought we’d instead look at the 100 day stochastic of the ratio. This simply takes the ratio and converts it into a range bound indicator with a maximum of 100 and a minimum of 0.

As you can see from the chart, the indicator is now almost back down to its lower extremes. Earlier this week the lowest it reached was 24. That is still a bit away from the lows it reached last summer but it is enough to warrant lightening any short positions.

Other measures of Rydex trading activity show even more positive bias. For example, if we look at the various Rydex sector mutual funds, we see that less than 10% of them have current assets higher than their 50 day moving average. This means that Rydex traders are exiting almost all sectors en masse. Historically when we’ve seen this level of reluctance to hold Rydex sector funds, a major low wasn’t too far away.

Another measure of Rydex activity focuses on the flow of funds into bullish mutual funds, both leveraged and non-leveraged funds. The pattern in this indicator is also bullish because Rydex traders are seriously paring their long exposure to equities.

By itself this or any other indicator is not to be trusted. But taken in concert with the other signs that we’ve seeing, including the option trading activity, this important contrarian indicator based on Rydex trading activity suggest that the market is about to find support at these levels.

Posted in Uncategorized | 3 Comments